The function calculates ellipse polygons, given centroid locations and sizing on the x and y axes.
st_ellipse(pnt, ex, ey, res = 30)Arguments
- pnt
Object of class
sforsfc(type"POINT") representing centroid locations- ex
Size along x-axis, in CRS units
- ey
Size along y-axis, in CRS units
- res
Number of points the ellipse polygon consists of (default
30)
Value
Object of class sfc (type "POLYGON") containing ellipse polygons
References
Based on StackOverflow answer by user fdetsch:
https://stackoverflow.com/questions/35841685/add-an-ellipse-on-raster-plot-in-r
Examples
# Sample data
dat = data.frame(
x = c(1, 1, -1, 3, 3),
y = c(0, -3, 2, -2, 0),
ex = c(0.5, 2, 2, 0.3, 0.6),
ey = c(0.5, 0.2, 1, 1, 0.3),
stringsAsFactors = FALSE
)
dat = st_as_sf(dat, coords = c("x", "y"))
dat
#> Simple feature collection with 5 features and 2 fields
#> Geometry type: POINT
#> Dimension: XY
#> Bounding box: xmin: -1 ymin: -3 xmax: 3 ymax: 2
#> CRS: NA
#> ex ey geometry
#> 1 0.5 0.5 POINT (1 0)
#> 2 2.0 0.2 POINT (1 -3)
#> 3 2.0 1.0 POINT (-1 2)
#> 4 0.3 1.0 POINT (3 -2)
#> 5 0.6 0.3 POINT (3 0)
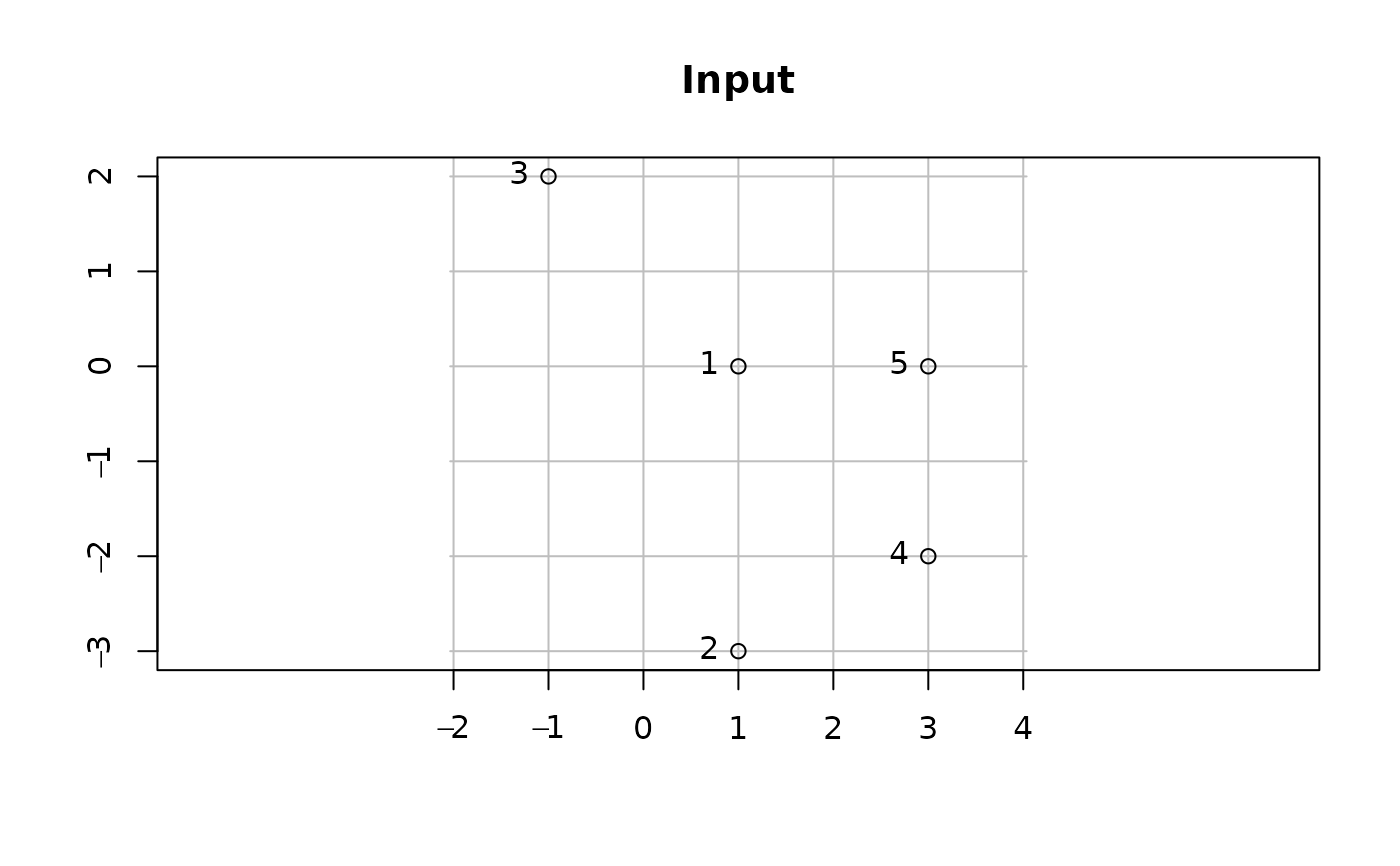
# Plot 1
plot(st_geometry(dat), graticule = TRUE, axes = TRUE, main = "Input")
text(st_coordinates(dat), as.character(1:nrow(dat)), pos = 2)
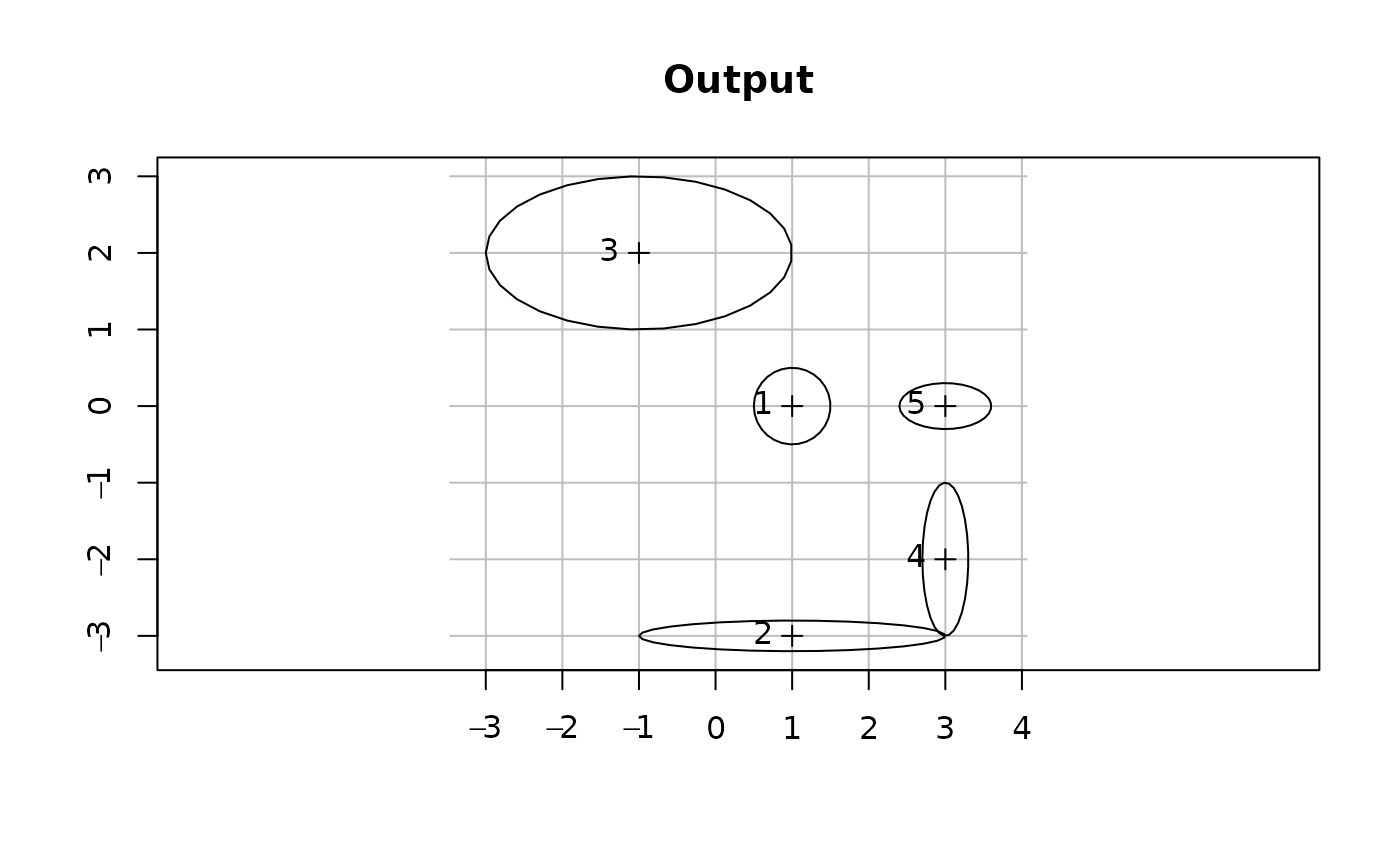
 # Calculate ellipses
el = st_ellipse(pnt = dat, ex = dat$ex, ey = dat$ey)
# Plot 2
plot(el, graticule = TRUE, axes = TRUE, main = "Output")
plot(st_geometry(dat), pch = 3, add = TRUE)
text(st_coordinates(dat), as.character(1:nrow(dat)), pos = 2)
# Calculate ellipses
el = st_ellipse(pnt = dat, ex = dat$ex, ey = dat$ey)
# Plot 2
plot(el, graticule = TRUE, axes = TRUE, main = "Output")
plot(st_geometry(dat), pch = 3, add = TRUE)
text(st_coordinates(dat), as.character(1:nrow(dat)), pos = 2)