Applies a focal filter with neighborhood size k*k on a raster (class stars), using R code. This function is relatively slow, provided here mainly for testing purposes or for custom using functions which are not provided by focal2.
focal2r(x, w, fun, mask = FALSE, ...)Arguments
- x
A raster (class
stars) with two dimensions:xandy, i.e., a single-band raster- w
Weights matrix defining the neighborhood size around the focal cell, as well as the weights. For example,
matrix(1,3,3)implies a neighborhood of size 3*3 with equal weights of 1 for all cells. Focal cell values are multiplied by the matrix values before being passed to functionfun. The matrix must be square, i.e., with an odd number of rows and columns.- fun
A function to be applied on each neighborhood, after it has been multiplied by the matrix. The function needs to accepts a vector (of length equal to
length(w)and return a vector of length1- mask
If
TRUE, pixels withNAin the input are set toNAin the output as well, i.e., the output is "masked" with the input (defaultFALSE)- ...
Further arguments passed to
fun
Value
The filtered stars raster
Note
The raster is "padded" with one more row/column of NA values on all sides, so that the neigborhood of the outermost rows and columns is still a complete 3x3 neighborhood. Those rows and columns are removed from the filtered result before returning it.
Examples
# \donttest{
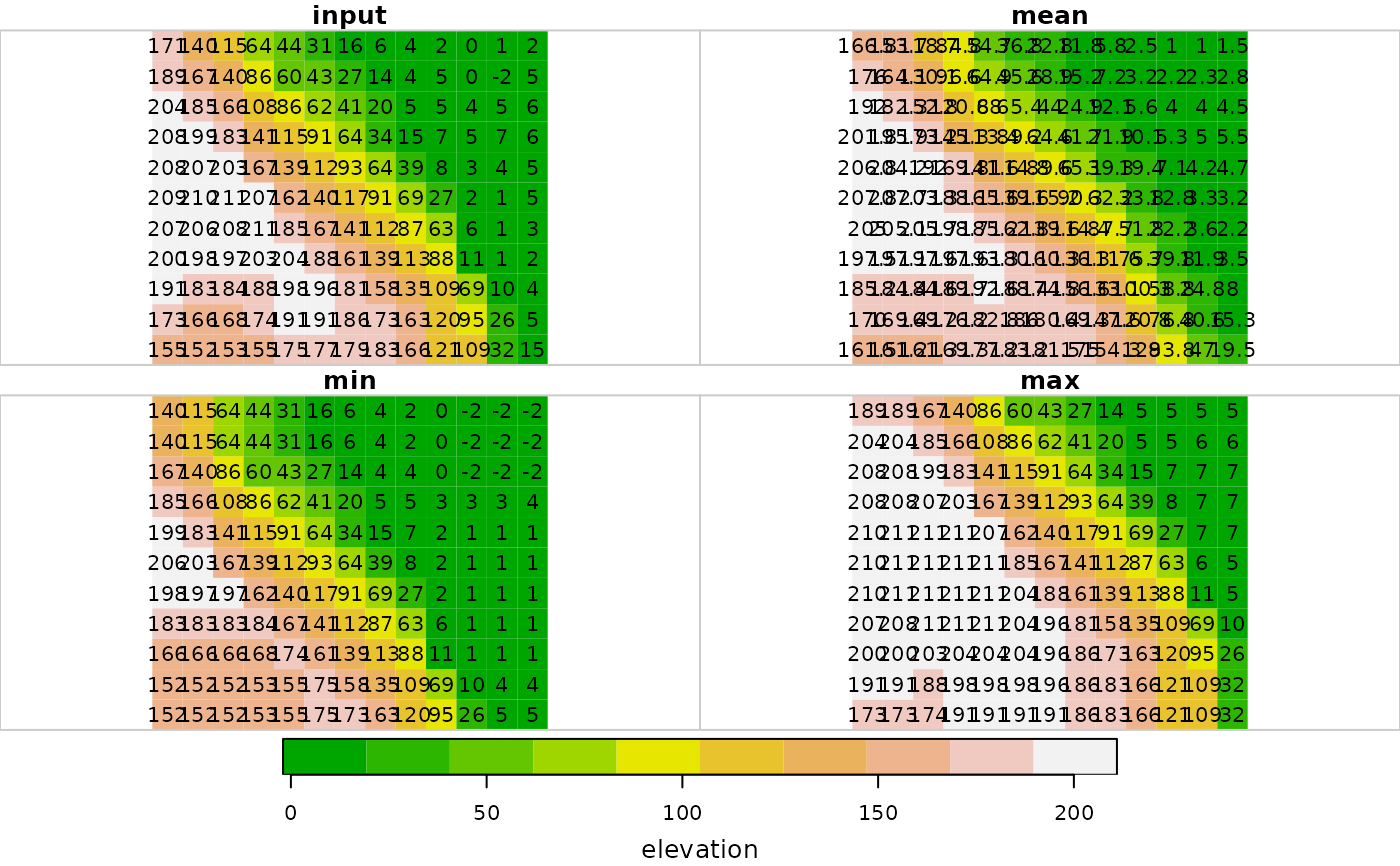
# Small example
data(dem)
dem1 = focal2r(dem, matrix(1,3,3), mean, na.rm = TRUE)
dem2 = focal2r(dem, matrix(1,3,3), min, na.rm = TRUE)
dem3 = focal2r(dem, matrix(1,3,3), max, na.rm = TRUE)
r = c(dem, round(dem1, 1), dem2, dem3, along = 3)
r = st_set_dimensions(r, 3, values = c("input", "mean", "min", "max"))
plot(r, text_values = TRUE, breaks = "equal", col = terrain.colors(10))

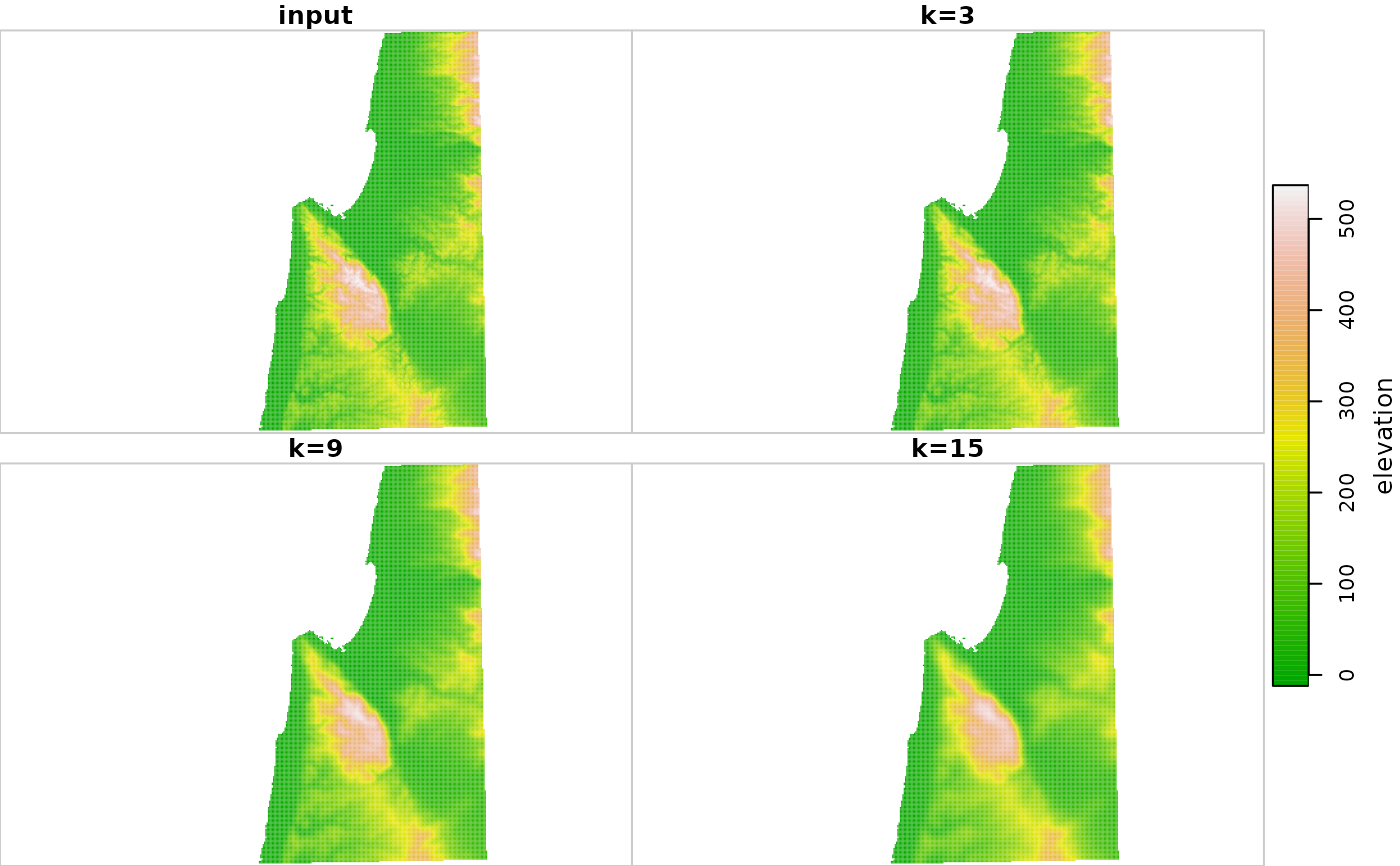
# Larger example
data(carmel)
carmel1 = focal2r(carmel, matrix(1,3,3), mean, na.rm = TRUE, mask = TRUE)
carmel2 = focal2r(carmel, matrix(1,9,9), mean, na.rm = TRUE, mask = TRUE)
carmel3 = focal2r(carmel, matrix(1,15,15), mean, na.rm = TRUE, mask = TRUE)
r = c(carmel, carmel1, carmel2, carmel3, along = 3)
r = st_set_dimensions(r, 3, values = c("input", "k=3", "k=9", "k=15"))
plot(r, breaks = "equal", col = terrain.colors(100))
#> downsample set to 1

# }
# }